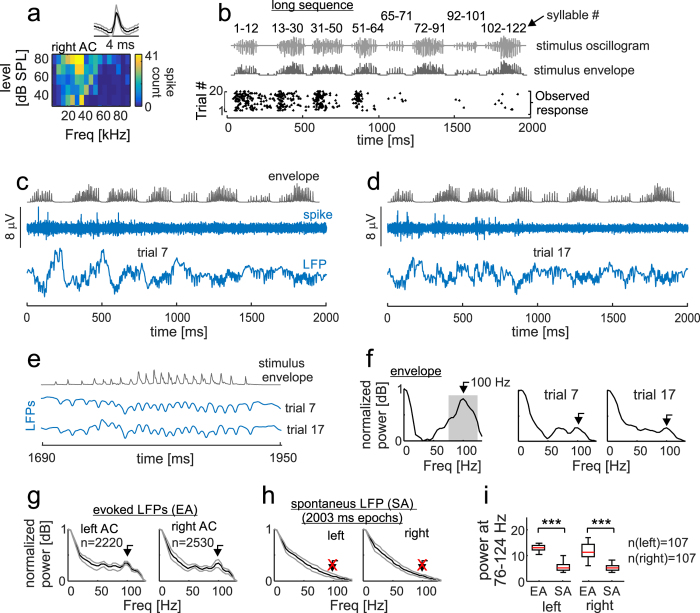
Figure 6. Steady-state local field potentials obtained in response to a long distress sequence.
(a) Shows the spike waveform (median in black, 25th and 75th percentiles in grey) and frequency-level receptive field of one neuron recorded in the right auditory cortex. (b) From top to bottom: oscillogram and energy envelope of the long distress sequence (syllable numbers are indicated), and the raster plot obtained when playing the sequence (“observed response”, black dots). (c–d) have a similar structure and show spike and local field potentials (LFPs) obtained in the same neuron represented in (a–b) during two trials of the long sequence. (c–d) Show (from top to bottom): the energy envelope of the distress sequence; the spike activity; and the LFP waves. (e) Shows a zoom-in on the sequence envelope and on the LFPs obtained in the same two trials represented in (c–d) (i.e. 1690–1970 ms after sequence start). (f) Shows the spectrum of the sequence envelope and the spectra of the LFP trials represented in (c–d). Spectra are represented in a logarithmic scale (i.e. in dBs) and are normalized to their maximum value. Note that the spectrum of the sequence-envelope peaked at 100 Hz, and a similar peak was found in the spectra of LFP trials. (g) Median normalized spectra obtained from all trials studied in each cortical hemisphere. Grey lines represent 25th and 75th percentiles. (h) Median spectra of LFP epochs recorded in the absence of acoustic stimulation (spontaneous activity, SA). SA epochs had a duration similar to that used for studying epochs of evoked activity (EA). No peak at 100 Hz was found in the median SA spectrum. (i) Comparison of median LFP power obtained in the 76–124 Hz band (see shaded area in f). Median power was calculated for each recording site by averaging across epochs obtained with or without acoustic stimulation (EA and SA, respectively). In the box-plots, central marks are medians, boxes indicate 25th and 75th percentiles, and the whiskers extend to the most extreme data points not considered outliers. The results of a paired Wilcoxon Signed-Rank tests are given (***p < 0.001).

