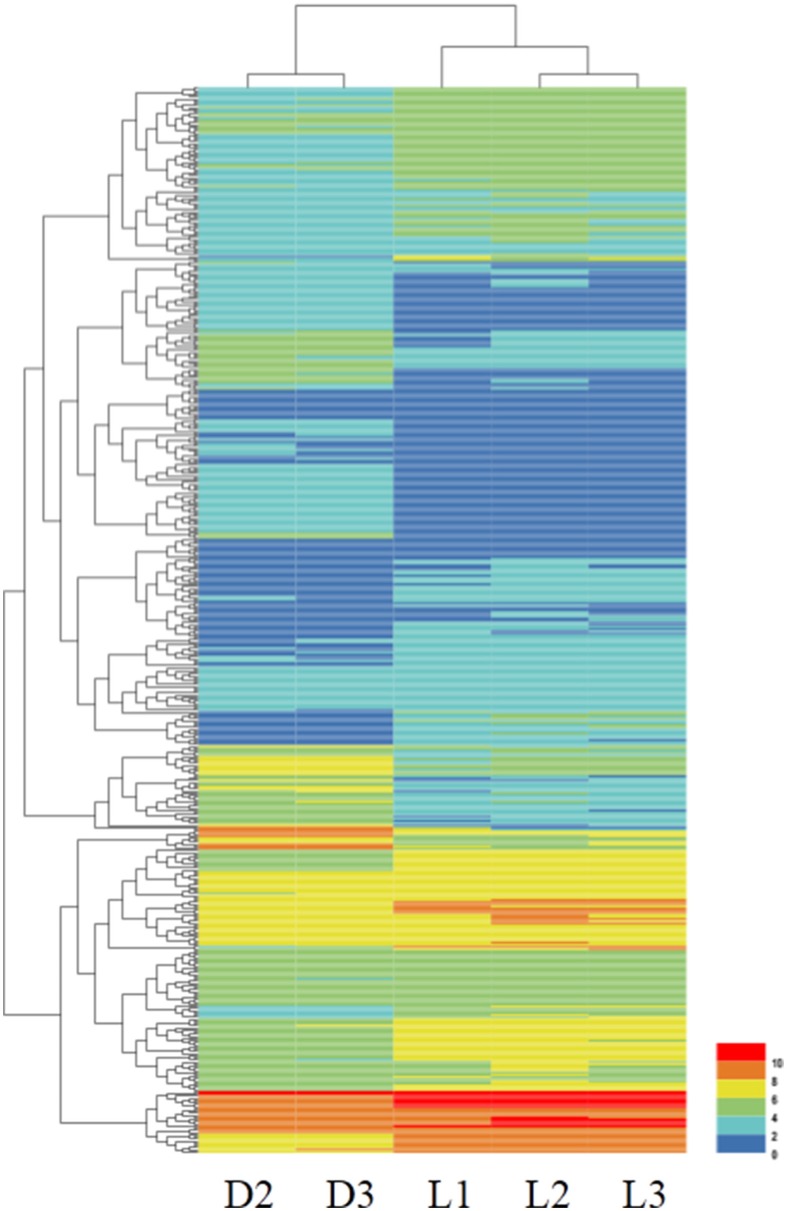
Figure 1.
Heatmap of the DEGs between the DPL and Landrace pigs. Columns represent individual samples. Rows indicate genes with significant expression differences between the two breeds. The color represents the gene expression levels in the sample. From 0 to 10, the gene expression levels increase gradually.

