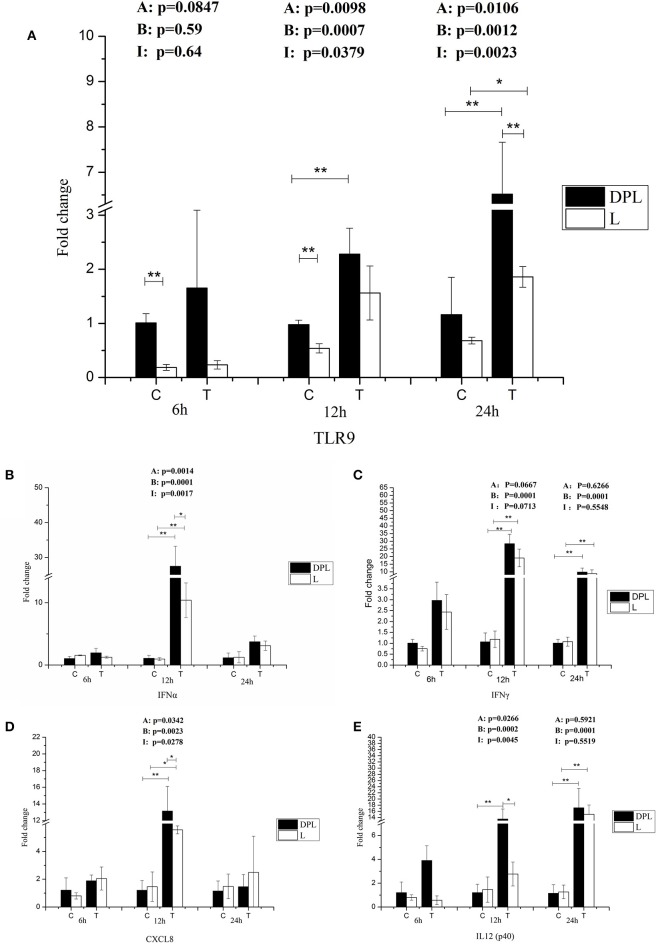
Figure 5.
TLR9 and cytokines gene expression in DPL and Landrace PBMCs after CpG ODN treatment. Gene expression of TLR9 and cytokines in stimulated DPL and Landrace PBMCs was assessed using qRT-PCR, the data were calculated by the 2−ΔΔCT method with B2M and PPIA as housekeeping genes. (A) TLR9, (B) IFNα, (C) IFNγ, (D) CXCL8, (E) IL12 p(40). At the each time point of 6, 12, and 24 h, the un-stimulated DPL and Landrace pig PBMCs samples as negative control. Data represent the mean ± SD from 6 different animals (*p < 0.05, **p < 0.01, Post-hoc test: Bonferroni-Holm). A, (Factor A = Breed); B, (Factor B = treatment); I, (Factor I = breed × treatment). C, control; T, treatment; L, Landrace; DPL, Dapulian.

