
Figure 8.
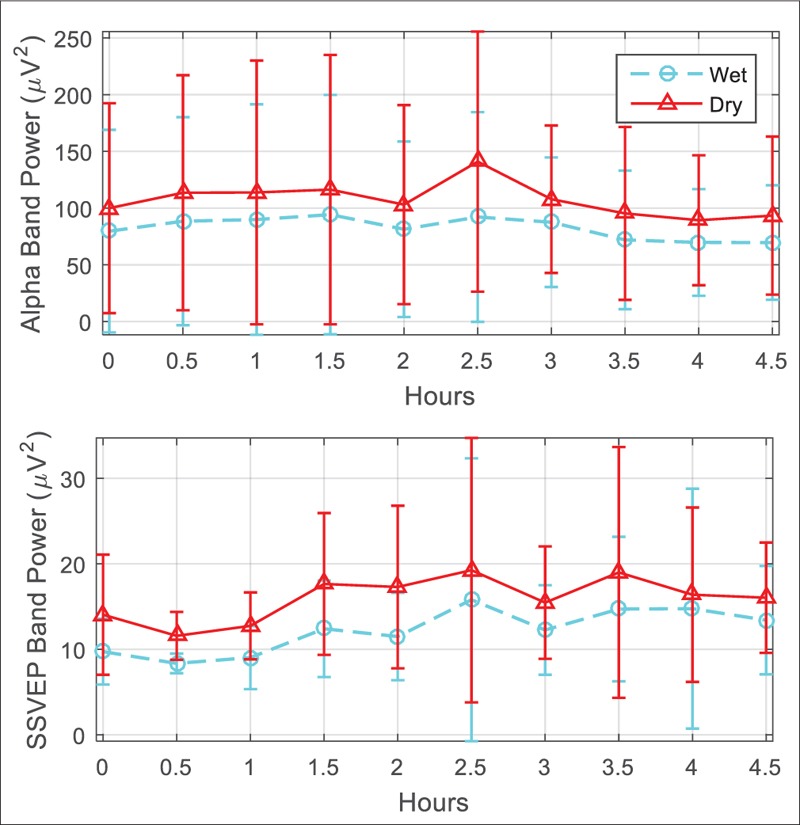
Comparison of alpha waves and steady state visual evoked potentials band power between the electrodes in the long-term electroencephalogram test. The bars demonstrate average and standard deviation of values from five participants during the experiment