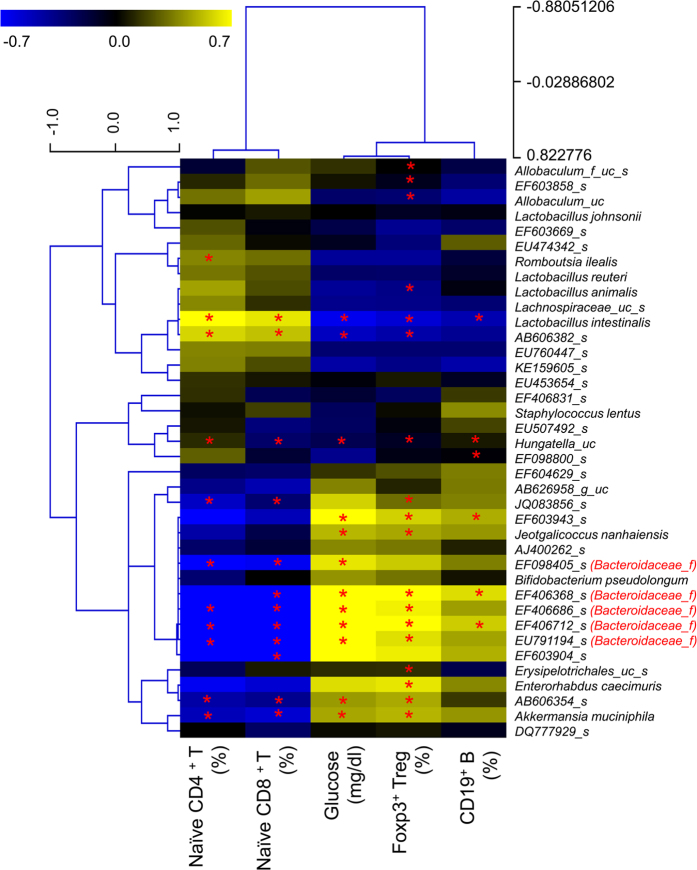
Figure 6. Correlation between the relative abundance of selected bacterial species (prevalence≥10%) and lymphocyte subset frequencies in middle-aged mice subjected to SYR or CR.
The heat map shows the nonparametric Kendall’s tau rank-correlation coefficients between bacterial abundance and lymphocyte subset frequencies and blood glucose levels. *P < 0.05. Experiments were repeated three times. Data are the averages of three independent experiments.

