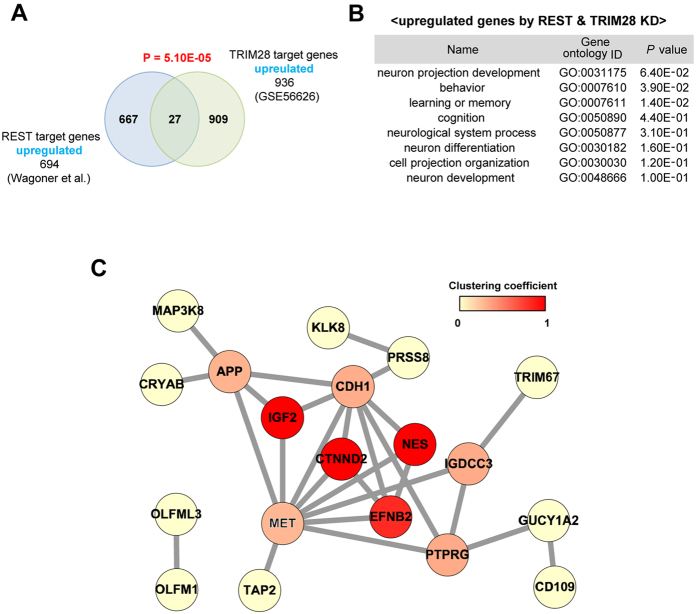
Figure 4. Co-regulated genes by REST and TRIM28.
(A) The overlap between differentially expressed transcripts following knockdown of REST and REST-interacting proteins is depicted as Venn diagrams. Blue and green circles indicate transcripts regulated by REST and TRIM28, respectively. (B) Gene Ontology (GO) analysis using gene sets upregulated by REST and TRIM28 knockdown. (C) Network analysis of gene set upregulated by REST and TRIM28 knockdown. Edges were drawn based on the STRING databases. The node color indicates the clustering coefficency. Fisher’s test was used for statistical analysis.

