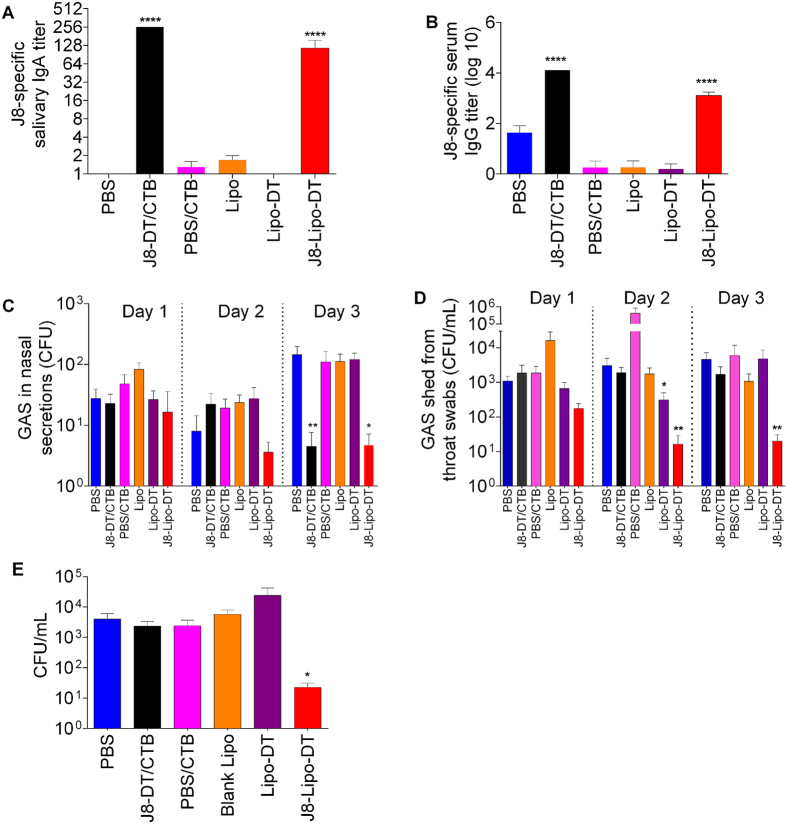
Figure 3. J8-specific antibody response and bacterial burden after intranasal challenge with M1 GAS strain in BALB/c mice (n = 10/group).
Mean antibody titers are represented as a bar + SEM. Bacterial burden results are represented as the mean CFU + SEM for 10 mice/group on days 1–3 for throat swabs and nasal shedding, and day 3 for NALT. (A) Salivary IgA titer. (B) Serum IgG titer. (C) Nasal shedding. (D) Throat swabs. (E) Colonization of NALT. Statistical analysis was performed using a nonparametric, unpaired Mann-Whitney U test to compare test groups to the PBS control group (ns, p > 0.05; *p < 0.05; **p < 0.01; ***p < 0.001).

