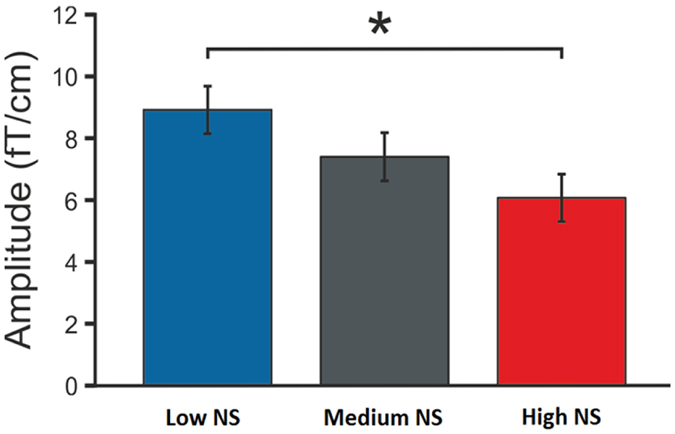
Figure 3. Mean amplitudes of magnetic MMN to the noise deviant in low, medium and high NS groups across all ROIs.

The asterisk indicates a significant difference (P = 0.007). NS = noise sensitivity.

The asterisk indicates a significant difference (P = 0.007). NS = noise sensitivity.