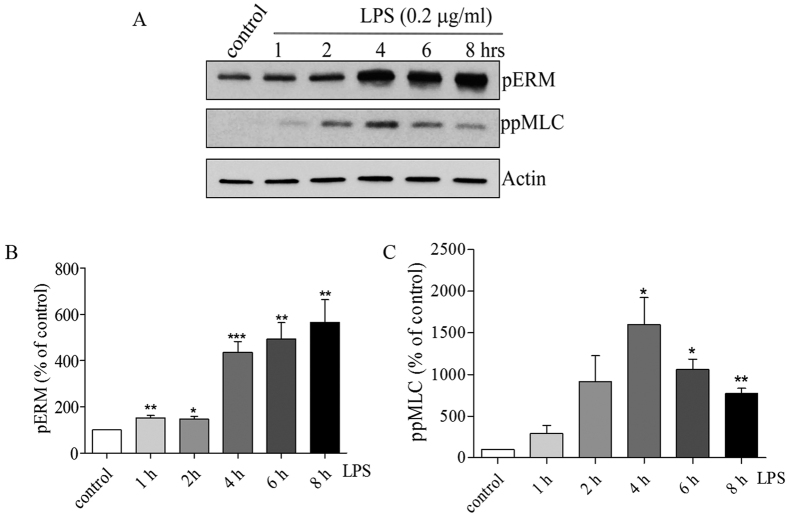
Figure 3. LPS induces phosphorylation of ERM and MLC in a time-dependent manner.
(A) Western blot analysis of the phosphorylation level of ERM proteins and phospho-MLC in HPAEC. Actin served as a loading control. HPAEC were treated with LPS (0.2 μg/ml) for the indicated time periods. (B/C) Bar graph shows the changes in protein levels of phospho-ERM and phospho-MLC quantified with scanning densitometry. Results are expressed as Mean ± SEM (n = 4 experiments). *P < 0.05, **P < 0.01, ***P < 0.0001 vs. control.

