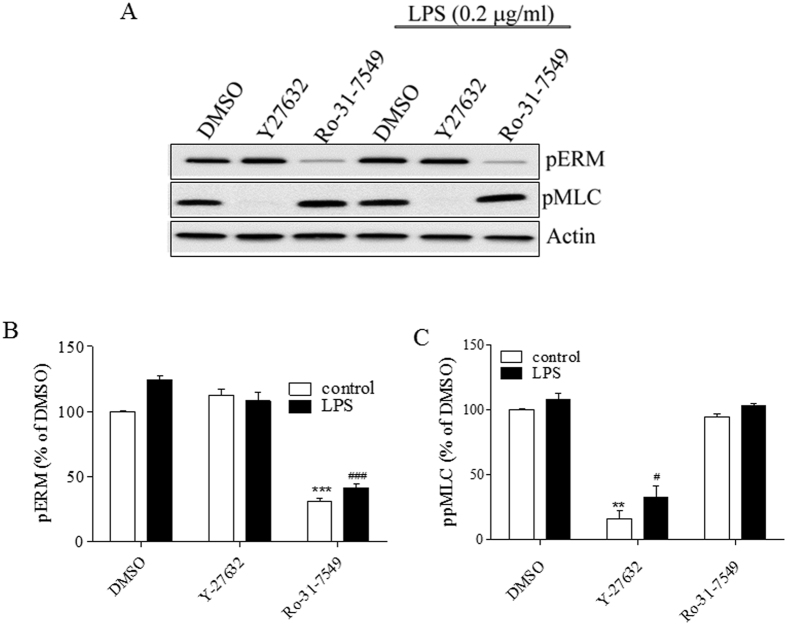
Figure 5. LPS-induced phosphorylation of ERM and MLC involves different signaling.
HPAEC were pretreated with ether a Rho-kinase (Y-27632, 10 μΜ), or a pan PKC (Ro-31-7459, 10 μΜ) inhibitor, or with DMSO (0.1%), one hour before adding LPS (0.2 μg/ml). At designated time, cells were harvested and analyzed by immunoblotting. (A) Representative immunoblots show the phosphorylation levels of phospho-ERM and phospho-MLC. (B/C) Bar graphs show the changes in the levels of phospho-ERM and phospho MLC quantified with scanning densitometry. Results are expressed as Mean ± SEM (n = 5 experiments). **P < 0.01, vs. DMSO control; #P < 0.05, ###P < 0.0001 vs. DMSO control/LPS.

