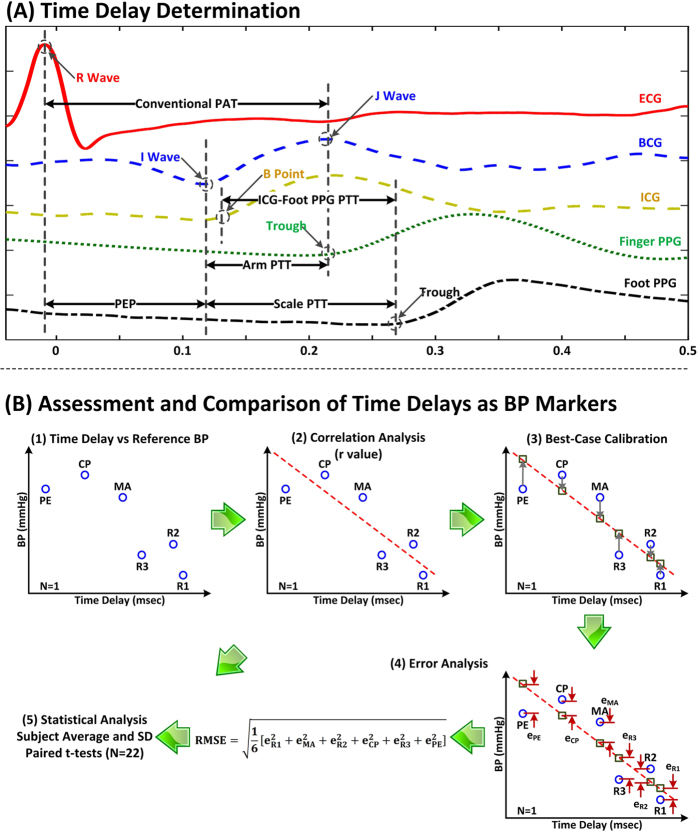
Figure 2. Data analysis for comparing scale PTT to conventional PAT as markers of BP in humans.
(A) Scale PTT, conventional PAT, PEP, and other time delays were detected from the waveforms. (B) The time delays were assessed and compared in terms of their ability to track the intervention-induced BP changes via the correlation coefficient (r) and root-mean-squared-error (RMSE) after a best-case calibration.

