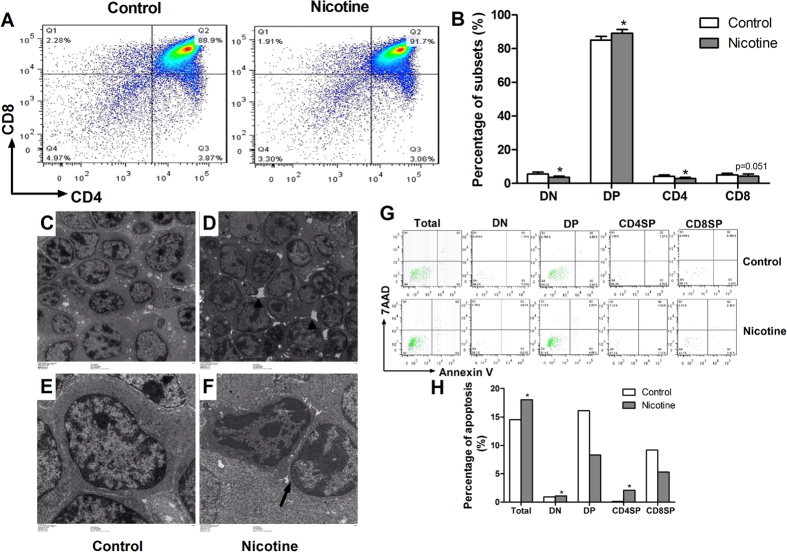
Figure 5. Effect of prenatal nicotine exposure (PNE) on the fetal thymocyte phenotypes and the fetal thymocyte apoptosis percentage.
(A) Typical flow diagram of fetal thymocyte phenotypes; (B) Percentage of subsets in fetal mice; (C) control group (TEM, ×1000); (D) nicotine group (TEM, ×1000); (E) control group (TEM, ×3000); (F) nicotine group (TEM, ×3000); (G) Typical flow diagram of fetal thymocyte apoptosis percentage; (H) Apoptosis percentage of fetal thymocytes. *P < 0.05, **P < 0.01 vs control.

