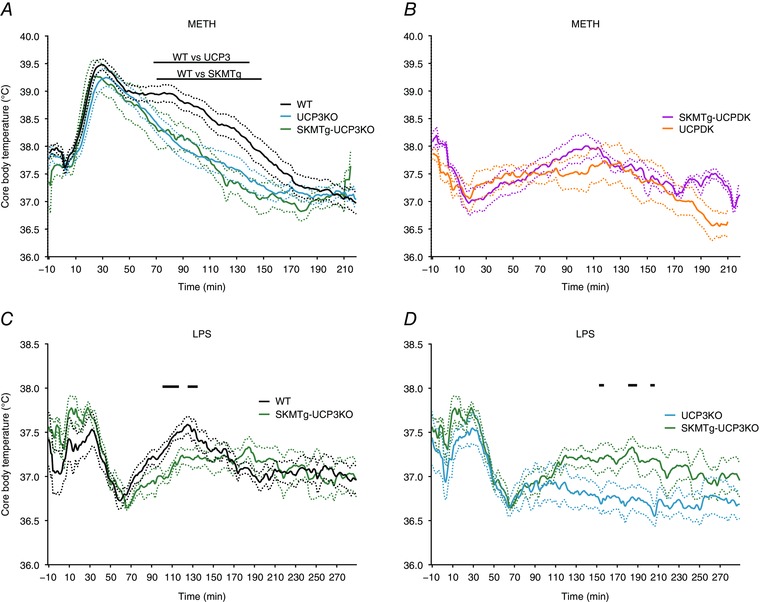
Figure 3. Skeletal muscle UCP3 expression has differential consequences for METH‐ and LPS‐induced thermogenesis.

A, METH (20 mg kg–1, s.c.) induced change in core body temperature of WT (black) UCP3KO (blue) and SKMTg‐UCP3KO (green, n = 9) mice. B, METH (20 mg kg–1, s.c.) induced change in core body temperature of UCPDK (orange) and SKMTg‐UCPDK (magenta, n = 4) mice. C, LPS (50 μg kg–1, i.p.) induced change in core body temperature of wild‐type (black line) and SKMTg‐UCP3KO (green, n = 4) mice. D, LPS (50 μg kg–1, i.p.) induced change in core body temperature of SKMTg‐UCP3KO (green) and UCP3KO (blue) mice. Dotted lines represent ± SEM. Black bars represent significance between groups with Welsh's two‐tailed t test, P ≤ 0.05. [Colour figure can be viewed at wileyonlinelibrary.com]
