
Figure 3. Selective carotid body dopamine secretory dysfunction in biotin‐deficient animals.
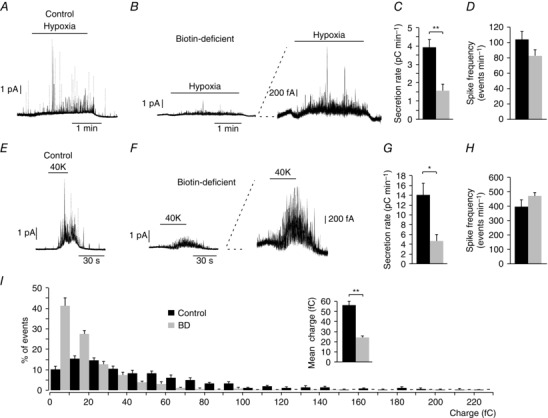
A and B, amperometric recordings showing glomus cell secretory responses to hypoxia in control and biotin‐deficient animals. Note in the trace at higher gain (B, right) that biotin‐deficient cells still retain their ability to respond to a decrease in O2 tension. C, average secretion rate induced by hypoxia in control (black, 3.92 ± 0.44 pC min−1, n = 23) and biotin‐deficient (BD) (grey, 1.56 ± 0.34 pC min−1, n = 13) animals. Control vs. BD hypoxia P < 0.01. D, spike frequency, measured in events per minute, elicited by hypoxia in control (black, 103.61 ± 10.51 events min−1, n = 13) and BD (grey, 82.34 ± 7.77 events min−1, n = 25) rats. Control vs. BD P > 0.05. E and F, secretory response to depolarization with 40 mM K+ in glomus cells from control and biotin‐deficient animals, respectively. Note in the trace at higher gain (F, right) that biotin‐deficient cells retain their ability to respond to high potassium. G, average secretion rate induced by high potassium in control (black, 14.1 ± 2.2 pC min−1, n = 20) and biotin‐deficient rats (grey, 4.6 ± 1.3 pC min−1, n = 19). Control vs. BD P < 0.05. H, quantification of the spike frequency induced in glomus cells by 40 mM K+ in control (black, 398.00 ± 45.42 events min−1, n = 9) and biotin‐deficient (grey, 470.76 ± 28.28 events min−1, n = 13) rats. Control vs. BD P > 0.05. I, frequency–charge distribution of individual exocytotic events elicited in response to hypoxia from glomus cells in carotid body slices prepared from control and biotin‐deficient rats (control, black, n = 970 spikes, 11 recordings; BD, grey, n = 1088 spikes, 15 recordings). The inset in I shows mean vesicle charge obtained from both groups of animals. Control, 56.4 ± 3.7 fc min−1, n = 970 spikes, 11 recordings; BD, 24.3 ± 1.5 fc min−1, n = 1088 spikes, 15 recordings. Control vs. BD P < 0.01.