
Figure 7. Basal respiratory parameters and ventilatory response to hypoxia in control and biotin‐deficient animals.
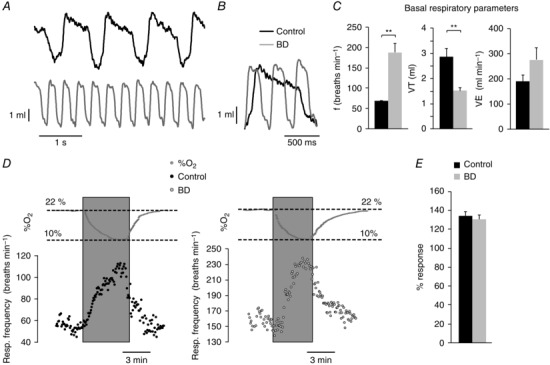
A, representative recordings of basal respiration in control and biotin‐deficient (BD) rats obtained by whole body plethysmography. B, superimposed traces from A to illustrate differences in respiratory frequency. C, average respiratory parameters from control (black, n = 18) and biotin‐deficient (grey, n = 14) animals during basal respiration. Respiratory frequency in breaths min−1 (left, control, 68.26 ± 1.85; BD, 187.76 ± 21.52; P < 0.001); tidal volume in ml (middle, control 2.85 ± 0.34; BD, 1.48 ± 0.17; P < 0.01); minute volume in ml min−1 (right, control, 192.63 ± 23.08; BD, 278.30 ± 47.05; P > 0.05). D, representative recordings of the ventilatory response to hypoxia (changes in %O2 are illustrated on top of the recordings) in control (left) and biotin‐deficient (right) rats. E, quantification of the increase in respiratory frequency in response to hypoxia of control (black, n = 13) and biotin‐deficient (grey, n = 8) animals. The effect of hypoxia is expressed as the percentage of frequency increase relative to the basal frequency in each group (control, 133.85 ± 4.31%; BD, 130.17 ± 4.50%; P > 0.05).