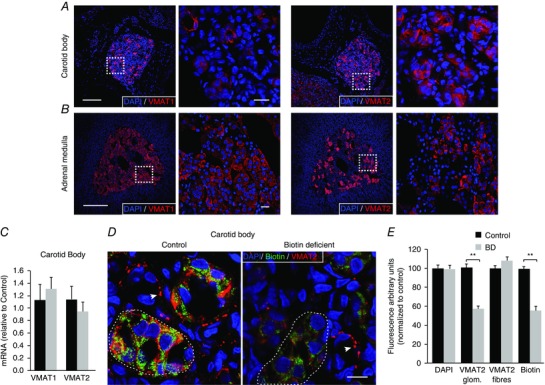
Figure 9. VMAT expression in carotid body and adrenal medulla: effect of biotin deficiency.

A and B, confocal images of carotid body and adrenal medulla slices illustrating the expression of VMAT1 (left) and VMAT2 (right). Scale bars = 0.5 mm. The squares in the low‐magnification images indicate the area expanded in the accompanying panels. Scale bars = 20 μm. Note that CB cells mainly express VMAT2. C, quantification of VMAT1 and VMAT2 mRNA expression in biotin‐deficient animals (grey) relative to control (black). VMAT1: Control (1.11 ± 0.28), biotin‐deficient (1.29 ± 0.24), P > 0.05; n = 4; VMAT2: Control (1.04 ± 0.18), biotin‐deficient (0.85 ± 0.13), P > 0.05, n = 5. D, confocal images illustrating biotin (green) and VMAT2 (red) co‐expression in CB slices of control and biotin‐deficient rats. Note the parallel decrease in both biotin and VMAT2 expression levels in the CB parenchyma (several CB glomeruli are encircled by the discontinuous line) in biotin‐deficient rats. In contrast, the intensity of VMAT2 immunostaining in fibres (white arrows) remained unaltered. Scale bar = 10 μm. E, quantification of changes in the level of intensity of VMAT2 (in glomeruli and fibres) and biotin labelling expressed as a percentage relative to control. DAPI has been quantified for reference (Control, 16 slices, 4 rats; BD, 20 slices, 5 rats). Decrease in fluorescence, expressed as a percentage relative to control: DAPI, 100.1 ± 2.4%, P > 0.05; VMAT2 glom., 58.2 ± 2.7%, P < 0.001; VMAT2 fibres, 108.5 ± 4.3%, P > 0.05; biotin, 56.4 ± 4.1%, P < 0.001.
