
Figure 2. Muscle strength, mass and architecture.
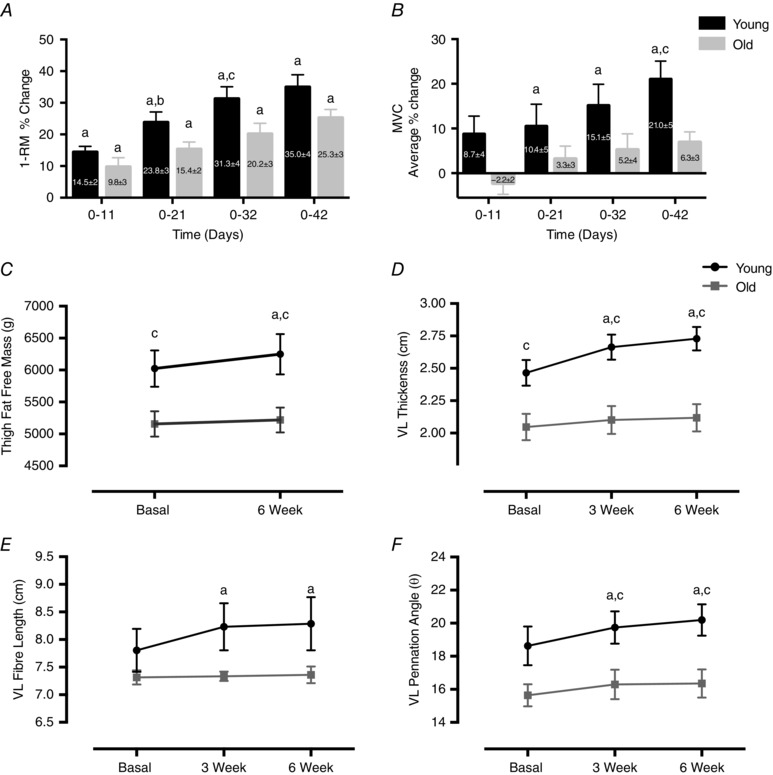
Time course of changes in T legs as percentage change in 1‐RM from baseline (A), average percentage MVC from baseline (B), thigh fat free mass 0–6 weeks (C), VL MT (D), L f (E) and θ (F). Values are means ± SEM. aSignificantly different from baseline, P < 0.05; bsignificantly different from previous time point, P < 0.05; csignificantly different from old, P < 0.05. 1‐RM, one repetition maximum; L f, fibre length; MT, muscle thickness; T, trained; VL, vastus lateralis; θ, pennation angle.