
Figure 15. Muscarinic receptor activation contributes to flow‐mediated endothelial Ca2+ signalling in large and small artery endothelial cells.
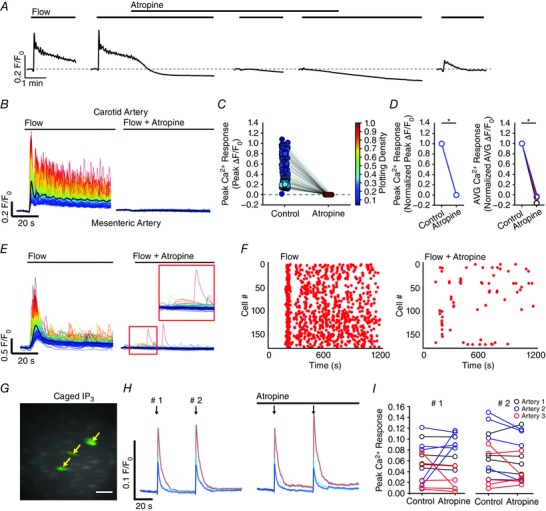
A, representative experiments (full‐field averages) showing the effect of atropine (100 nm) on flow‐evoked (1.5 ml min−1) Ca2+ signals. B–D, flow‐induced cellular Ca2+ traces (B) in the absence (left) and presence (right) of atropine. Paired peak ΔF/F 0 responses (C) from the data shown in (B); the response of each cell paired with itself is shown. Paired summary data (D) illustrating changes in peak (left) and time‐average (right) ΔF/F 0 values, averaged across individual cells and normalized to control responses per experiment. E–F, flow‐induced cellular Ca2+ traces (E) from a mesenteric artery in the absence (left) and presence (right) of atropine (100 nm), and rastergrams of Ca2+ activity corresponding to data shown in (D). Data in (E) to (F) are representative of that obtained in three separate experiments. In (E), the red outlined inset shows that some small scale Ca2+ activity persists in the presence of atropine, despite the lack of a large‐scale response to flow. G–I, effect of atropine (100 nm) on Ca2+ responses stimulated by photolysis of caged IP3. G, Ca2+ image with cells activated by photolysed caged IP3 indicated by yellow arrows. H, Ca2+ signals, corresponding to the image shown in (G) in the absence (left) and presence of atropine. I, paired summary data illustrating effect of atropine on IP3‐evoked Ca2+ signals; technical replications (cells from an individual artery) are grouped and indicated by the plot colour. * P < 0.01 vs. control.