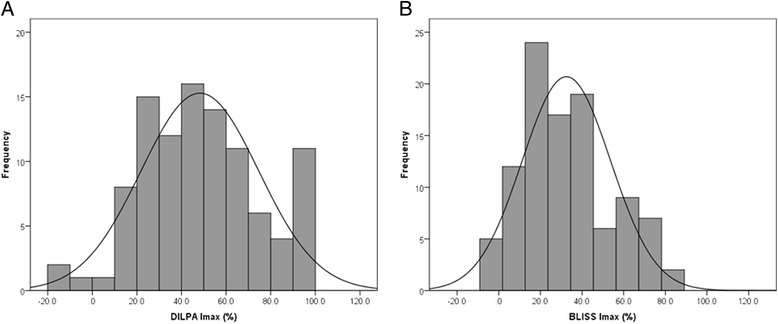
Fig. 1.

Distribution of Imax for DILPA a and BLISS assay b. Frequencies have been binned in 10% groups in 101 healthy control samples and the normal distribution curve overlaid. The mean and standard deviation for DILPA is 48% and 26 and for BLISS 32% and 21, respectively. Their distributions are significantly different (unpaired t-test p < 0.001)
