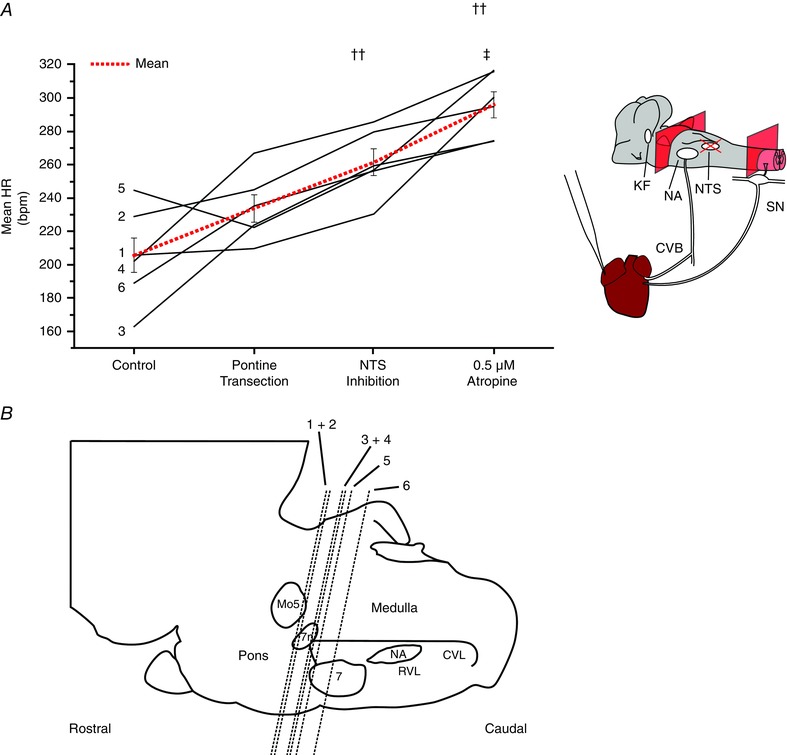
Figure 8. Pontine and medullary sources of cardiac vagal tone.

Cardiac vagal tone was again quantified by comparing the HR before the removal of suspected sources of cardiac vagal tone with its final level after systemic atropine. The magnitude and direction of changes in HR produced by pontine transection varied greatly between experiments, indicating the presence of both excitatory and inhibitory influences on cardiac vagal tone (A). Substantial cardiac vagal tone survived this procedure. Subsequent inhibition of the NTS produced an increase in HR indicating that this is a source of cardiac vagal drive. The level of transection from each experiment can be seen in (B). Data are values from individual experiments (black lines) and are the mean ± SEM (red dashed lines)., ††P < 0.01 compared to pontine transection; ‡P < 0.05 compared to NTS isoguvacine, paired t test (n = 6). 7, facial nucleus; 7n, facial nerve; CVL, caudal ventrolateral medulla; Mo5, motor trigeminal nucleus; RVL, rostral ventrolateral medulla. [Colour figure can be viewed at wileyonlinelibrary.com]
