Fig. 1.

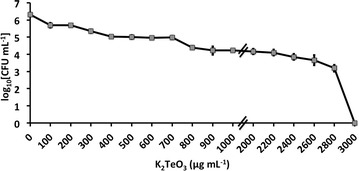
Kill curve of Rhodococcus aetherivorans BCP1 exposed for 24 h to increasing concentration of K2TeO3, with the established minimal inhibitory concentration (MIC)

Kill curve of Rhodococcus aetherivorans BCP1 exposed for 24 h to increasing concentration of K2TeO3, with the established minimal inhibitory concentration (MIC)