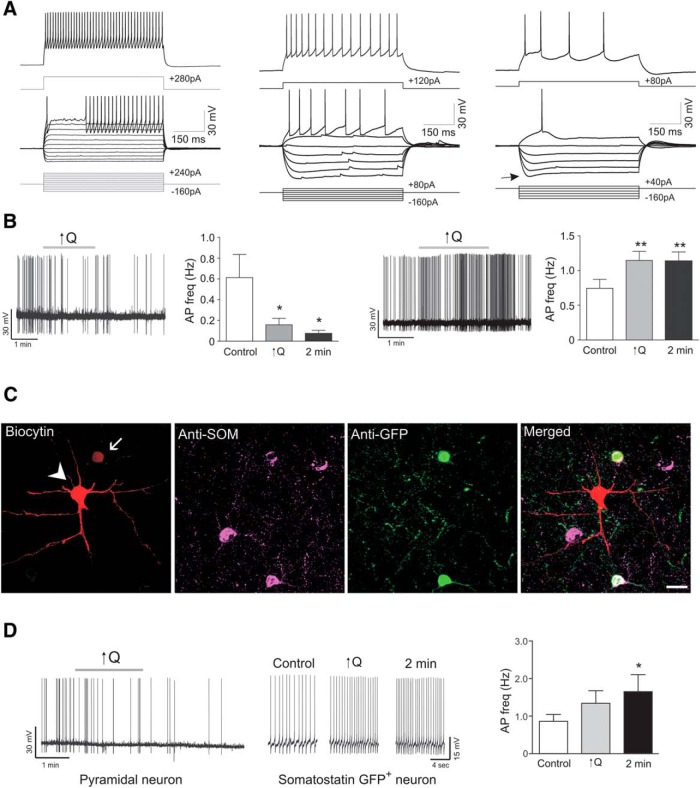
Figure 6.
Increased flow/pressure-evoked changes in interneuron firing activity. A, Representative square pulse trace showing various subtypes of interneuron firing pattern. B, Left, Representative trace and summary data showing flow/pressure-evoked inhibition of interneuron firing activity in response to a modest increase in Q (0.1 to <0.5 μl/min) from rat cortical slices. Right, Representative trace and summary data showing flow/pressure-evoked increases in interneuron firing activity following ↑Q from rat cortical slices. C, Immunostaining corresponding to a paired recording from a pyramidal neuron (arrowhead) and a GFP+ somatostatin neuron (arrow) from GIN mouse. Scale bar, 20 μm. D, Paired recording in current clamp showing action potential firing activity for a pyramidal neuron (left) and a GFP+ and somatostatin+ neuron (right) in response to increases in flow (↑Q). Error bars indicate SEM. *p < 0.05 (one-way repeated-measures ANOVA followed by Dunnett's test). **p < 0.01 (one-way repeated-measures ANOVA followed by Dunnett's test).

