Figure 6.
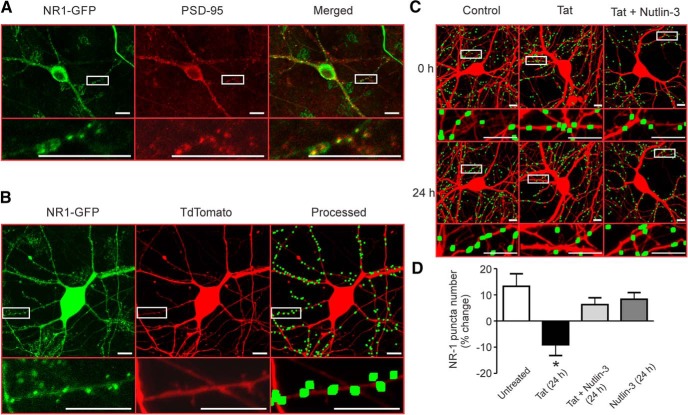
Loss of NMDAR puncta during exposure to Tat is prevented by inhibition of Mdm2. A, Representative images showing a neuron transfected with NR1-GFP and stained with antibodies for GFP (left) and PSD-95 (middle). The merged images (right) show colocalization (yellow). Insets are enlarged regions of boxed images. Scale bars, 10 μm. B, Representative images showing maximum z projection of a neuron expressing NR1-GFP (left) and tdTomato (middle). After puncta processing (see Materials and Methods), puncta were dilated and overlaid on the tdTomato image (right). C, Representative processed images before (0 h) and after (24 h) no treatment (control), treatment with 50 ng/ml HIV-1 Tat (Tat), or treatment with Tat + 1 μm Nutlin-3. D, Bar graph summarizing the percentage change in NR1-GFP puncta at 24 h relative to 0 h images from neurons with or without Tat treatment and in the presence or absence of Nutlin-3 for 24 h. Data are shown as mean ± SEM (n ≥ 5 for all groups). *p < 0.05 relative to all other groups (one-way ANOVA with Tukey's post hoc test).

