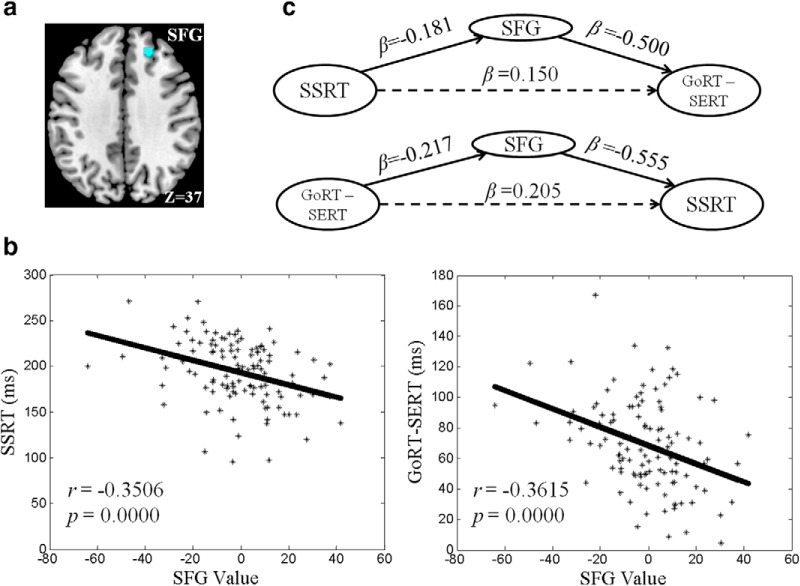
Figure 4.
a, A cluster in the right SFG with responses to p(Stop) that correlate linearly with both SSRT and GoRT − SERT. b, SFG activity (contrast value) is linearly correlated with both SSRT and GoRT − SERT. c, Mediation analysis showing that SFG activity mediates the correlation between SSRT and GoRT − SERT bidirectionally.

