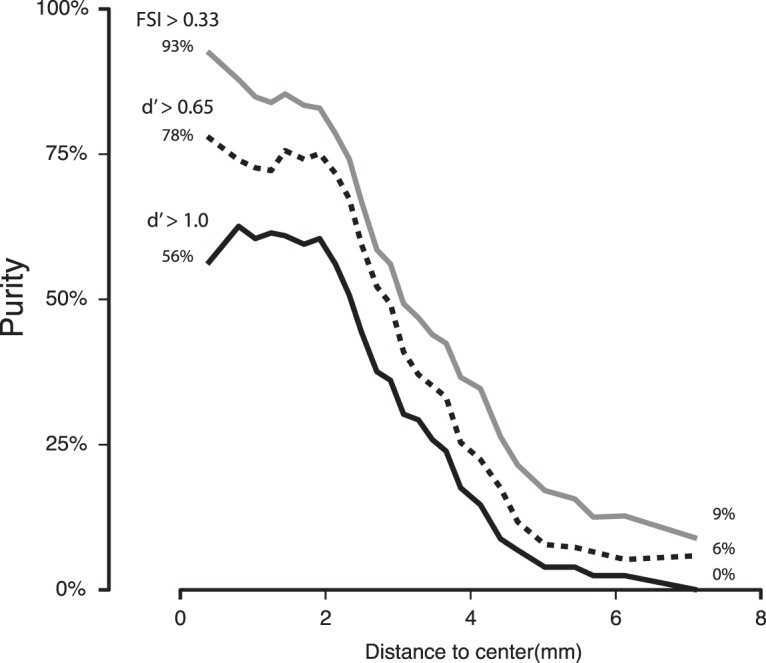
Figure 10.

Average spatial profile of the number of face-selective sites in the pMFP. We estimated the purity collapsed across both animals using the estimated center from the isotropic Gaussian spatial model. The empirical purity function across both animals is remarkably consistent in shape across different selectivity estimators. The plot represents the proportion of face-selective sites across both animals under various criteria for face selectivity. Not surprisingly, weaker thresholds resulted in higher estimates of the purity near the center and far outside the pMFP.
