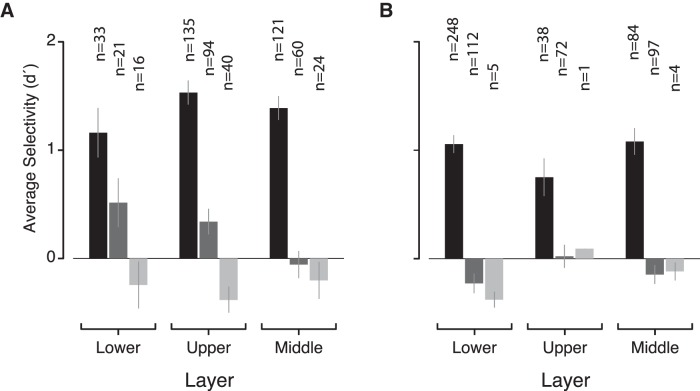
Figure 14.
Face selectivity estimates for upper, lower, and middle cortical layers. Separating sites by upper and lower layers produces similar selectivity estimates of the average selectivity in the “in,” “near,” and “far” regions (black, dark gray, and light gray bars, respectively), in either subject (A: Monkey 1; B: Monkey 2).

