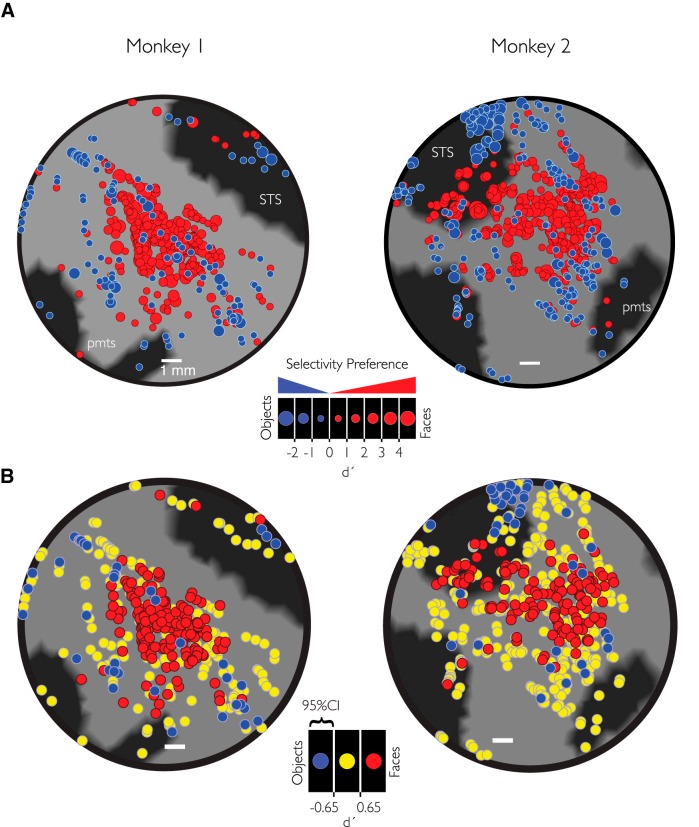
Figure 3.
pMFP contains an enrichment of face-preferring sites. A, Flattened 2D regions of the temporal lobe highlight category preference. Red represents sites that prefer faces over objects. Blue represents sites that prefer objects over faces. M1, n = 425; M2, n = 565 multiunit sites. The size of each circle represents the strength of selectivity at each site. B, Distribution of highly category-selective sites. Red or blue sites responded preferentially to faces (d′ > 0.65) or objects (d′ < 0.65), respectively. Yellow represents sites where the 95% CI of the site's selectivity metric fell within [−0.65, 0.65] and thus is not significantly above (or below) those two thresholds. Scale bars represent 1 mm.

