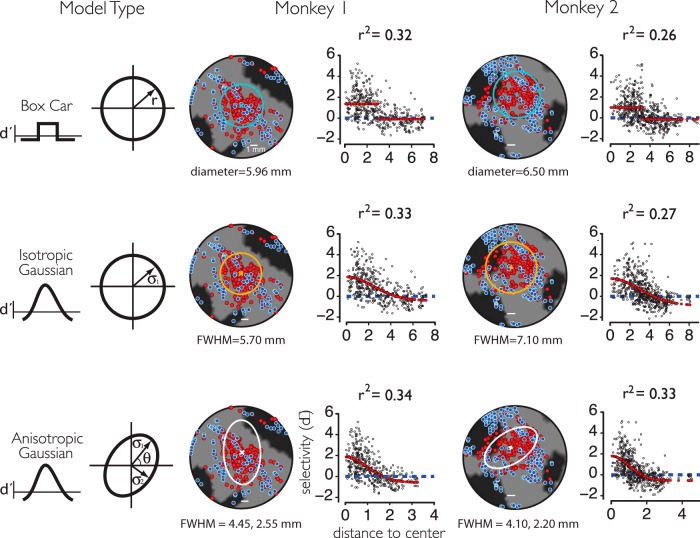
Figure 4.
2D models of the spatial organization of face selectivity on the pMFP. Three models (rows: box car, isotropic Gaussian, and anisotropic Gaussian) for the spatial structure of the pMFP were used to fit the category selectivity and 2D spatial position over all multiunit samples. Column 1 summarizes each model and their 2D spatial parameters parameters (see Materials and Methods). Column 2 (monkey 1) and column 3 (monkey 2) summarize the results in each subject. The best fit models are displayed as outlines on the flattened 2D cortical maps (left) with the estimated size parameter for each model type underneath. In addition, the collapsed, 1D selectivity profiles (right) as a function of radial distance are shown (black dots represent individual sites), and the collapsed model prediction is overlaid in red. Abscissa units are in millimeters for the box car and isotropic Gaussian models (rows 1–2) and in number of SDs for the anisotropic Gaussian model (row 3) since the isocontours for this model were not radially symmetric. Variance explained was calculated as the correlation of the model predictions (red) with the individual site d' values (black dots) at the corresponding location (values were not corrected for noise in the neural data, but see Fig. 6 for estimates of noise levels). Scale bars represent 1 mm.

