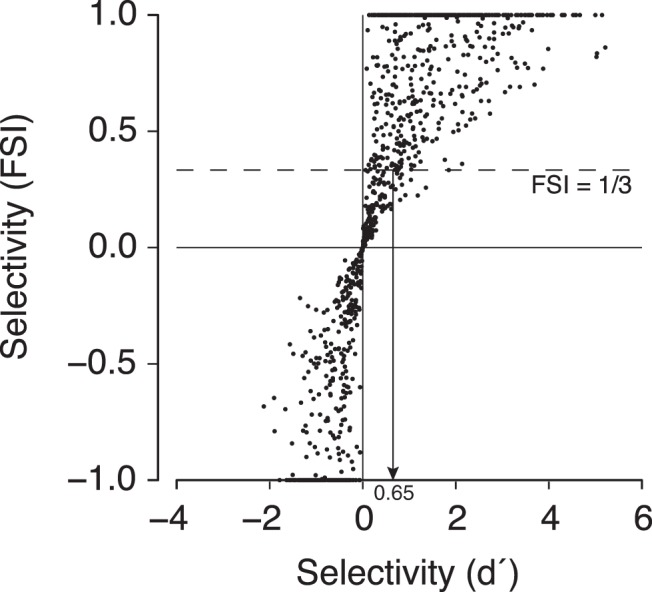
Figure 7.

Direct comparison of d′ and FSI contrast metrics. Absolute values of d′ depend critically on how one defines response variance (see Materials and Methods). The FSI metric displays an approximately linear relationship to selectivity measured with d′. In our data, an FSI ∼ 1/3 is equivalent to a range of d′ values with a median of 0.65. Most of these sites with a d′ > 0.65 have a face image preference significantly different from zero (422 of 424 sites with d′ > 0.65 had a bootstrapped 95% CI >0).
