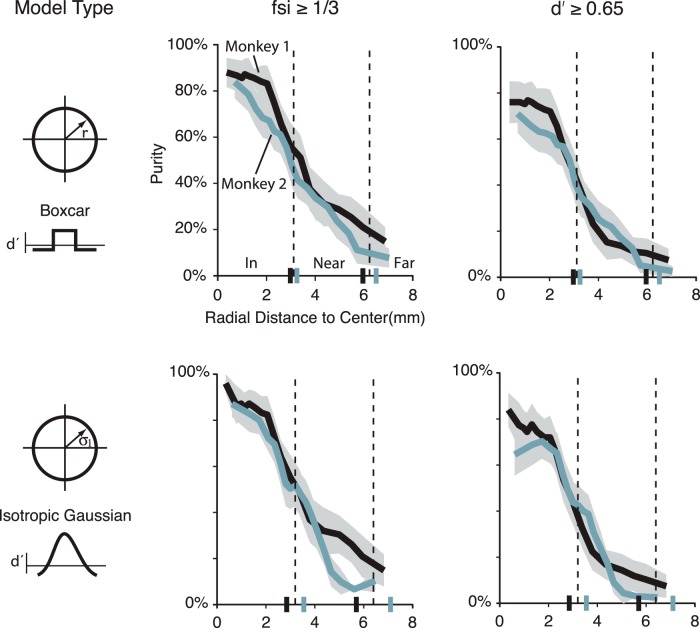
Figure 8.
Functional selectivity and purity estimates in the pMFP as a function of spatial size. Estimates of the fraction of category-selective multiunit sites in the MFP (the purity) could range from 94% to 58% depending on the distance from the center of the patch. These ranges varied due to both the model and metric used to define the patch. Purity estimates based on an FSI > 0.33 led to higher overall purity estimates than those based on a comparable d′. Overall, the purity falls off gradually from the center of the patch to cortical regions outside the patch. Dotted lines indicate the radial average distance from the center, which defines the qualitative distance categories: “in,” “near,” and “far,” where “in” is defined as less than radius value determined in the model fit and “far” is > 2 times the radius value. Small vertical lines on the abscissa indicate 1 and 2 times the radius value for each subject by model type.

