
Figure 9.
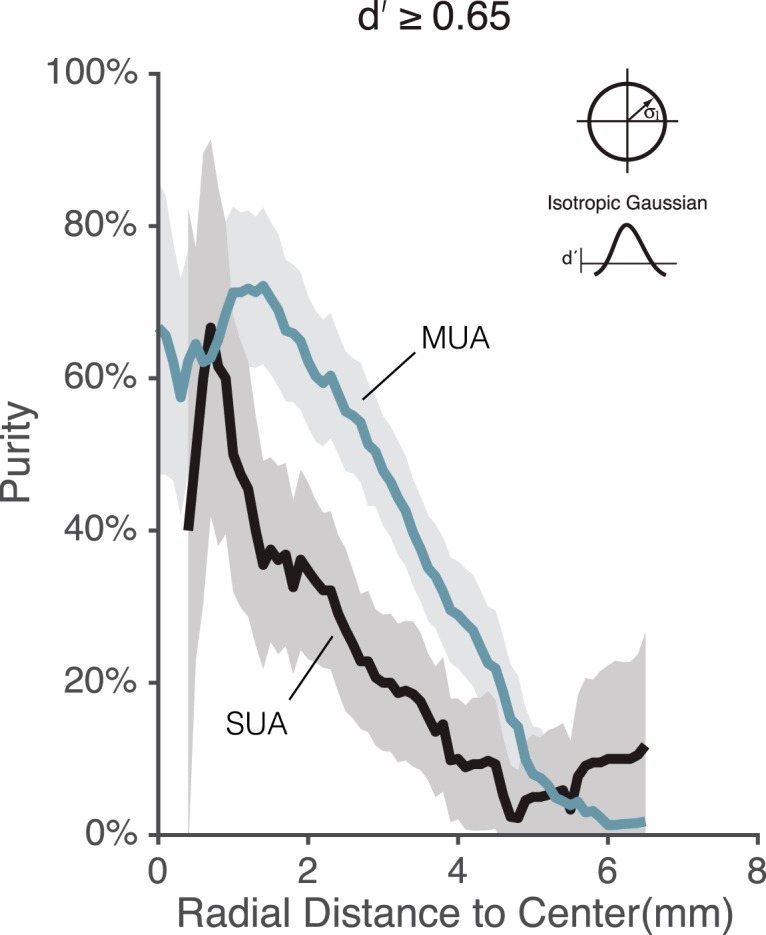
Comparison between single-unit and multiunit purity estimates in the pMFP as a function of spatial size. Spike waveforms from Subject M2 were sorted to provide SUA. Using the center of the isotropic Gaussian model fit to the MUA data, we plotted the fraction of face-selective sites (purity) for both MUA (gray line) and SUA (black line) as a function of distance from the center. In both cases, a site was defined as face-selective if its d′ was ≥0.65. Both MUA and SUA produced a gradual fall-off in purity over a similar spatial range, although MUA data showed slightly higher d′ values and thus slightly higher purity estimates. Gray line indicates Monkey 2 curve in Fig. 8, but using sliding 1-mm-wide spatial bins to exactly match the procedure applied to the SUA. Error bands indicate the SEM of the estimated purity values determined by bootstrap (see Materials and Methods).