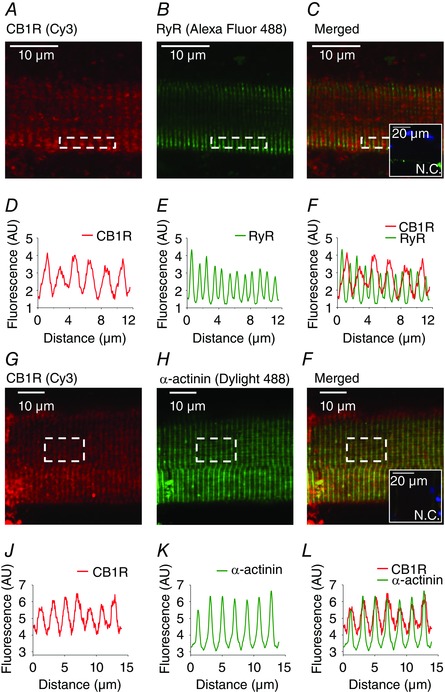
Figure 1. CB1 receptor localizes around the Z‐lines of FDB fibres.

Representative confocal immunofluorescence images showing the localization of (A and G) CB1R (labelled with Cy3, red) around the Z‐lines, (B) ryanodine receptors (RyR, labelled with Alexa Fluor 488, green) in the T‐tubules of the SR and (H) α‐actinin at the Z‐lines (labelled with Dylight 488, green). C and I, merged images of (A) and (B) with (G) and (H), respectively. C and I, inset: a negative control image, stained with both secondary antibodies and showing labelling of the nuclei (DAPI, blue). D–F and J–L, fluorescence intensity of (A) to (C) and (G) to (I), respectively, plotted under each image. Images were recorded from 1 μm thick optical slices. Original magnification: 40×.
