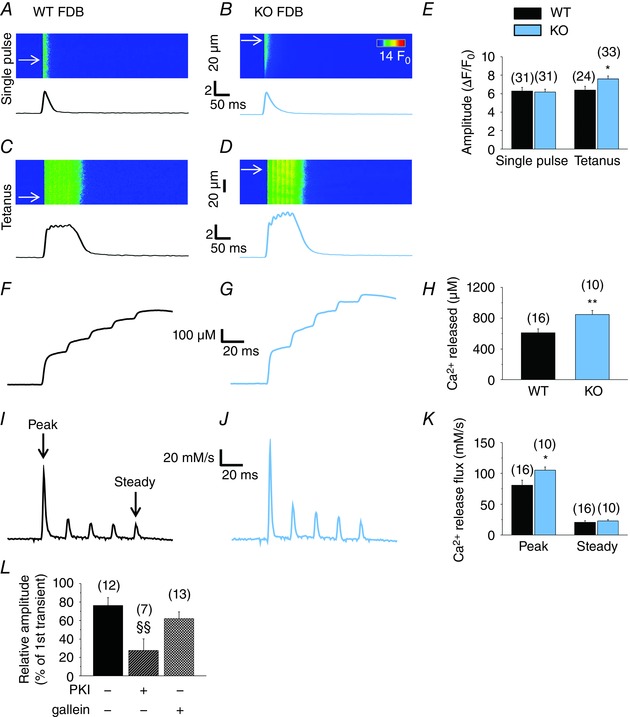
Figure 8. Tetanic electric stimulus evoked Ca2+ transients, Ca2+ release flux and the amount of released Ca2+ are higher in KO fibres.

Confocal line‐scan images were recorded on Rhod‐2‐loaded FDB fibres of WT and KO mice during field‐stimulation. Representative records of Ca2+ transients evoked by a single stimulatory impulse (A in WT and B in KO FDB) or a tetanic stimulus (C in WT and D in KO FDB). Time courses were calculated from the average of eight to 20 lines indicated by arrows on the line‐scan images. E, pooled data of the amplitude of the transients. Representative records of the total released amount of Ca2+ ([Ca2+]T) in (F) WT and (G) KO FDB fibres. H, pooled data of [Ca2+]T. I and J, corresponding calcium release flux through RyRs in WT and KO fibres, respectively. K, pooled data of the peak (first peak) and steady level (fifth peak) of the calcium release flux. L, two consecutive single stimuli were applied with a 5 min delay and, during the intermittent period, either PKI (1 μm) or gallein (20 μm) was applied to the fibres. Relative amplitude of the second transients, expressed as a percentage of the first transient on the same fibre before the treatment. Numbers in parentheses show the number of FDB fibres examined. * P < 0.05 and ** P < 0.01, respectively, WT vs. KO mice. §§P < 0.01, PKI‐ or gallein‐treated WT vs. untreated. [Colour figure can be viewed at wileyonlinelibrary.com]
