
Figure 1. Plot of mean probability of correct RMET response per valence category.
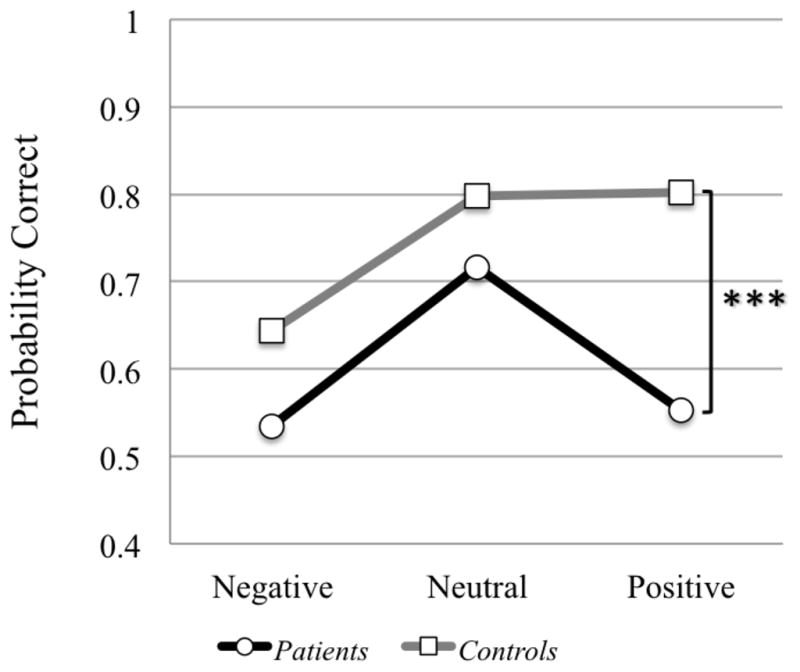
Comparison of probability of correct answers on RMET valence categories (negative, neutral and positive stimuli) for all patients in comparison to controls. Cerebellar patients were significantly less likely to score correct on positive stimuli than healthy controls (*** = p <.001). This pattern was consistent within all patient groups (CD=ID). A p <.05 was considered statistically significant.