Figure 2.
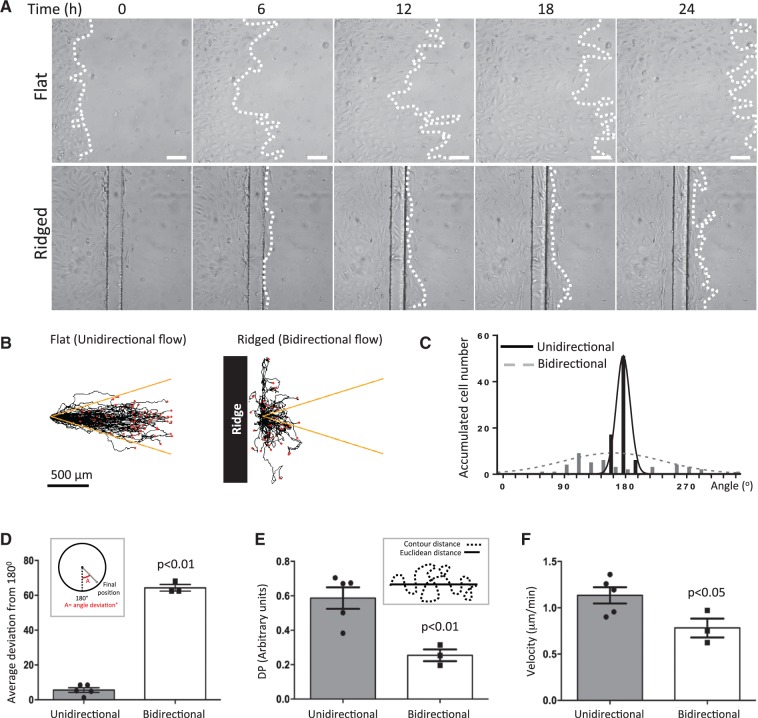
The migration pattern of EC was disrupted under bidirectional flow. HUVEC were seeded on flat or ridged slides (upstream from the first ridge) and their migration under flow was monitored by time-lapse imaging for 72 h. (A) Representative images. Flow at inlet is from left to right. White dotted lines represent leading edge of monolayers. White bar = 100 μm. (B–D) Single cell tracking analysis of cells exposed to unidirectional or bidirectional (downstream from ridge) flow. (B) Migration paths are shown. Flow at inlet is from left to right. Each red dot represents a cell. Yellow lines indicate a 15% deviation from the inlet flow direction. (C and D) For each cell, the angle between its final position and the inlet flow direction (180°) was calculated (angle deviation). (C) Angle deviations were divided into 20 × 18° groups and the number of cells in each group is shown. (D) Angle deviations, (E) directional persistence and (F) average velocities were calculated. Data were pooled from five independent experiments and mean values +/− SEM are shown alongside individual data points. Differences between means were compared using an unpaired t-test.

