Figure 6.
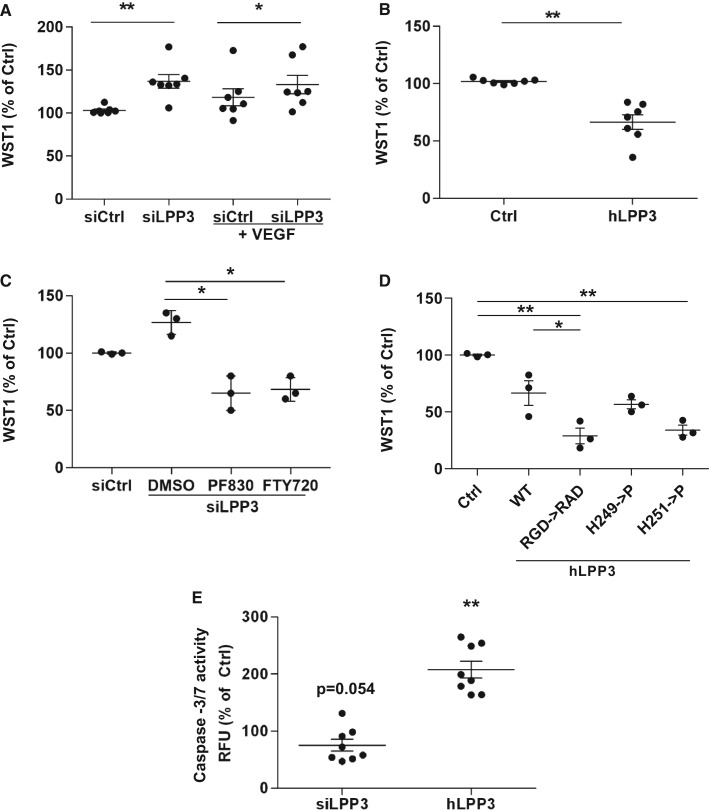
LPP3 affects viability of HAECs. HAECs were transfected with either siRNA (siCtrl or siLPP3) (A) or with hLPP3 expression plasmids (Ctrl or LPP3) (B) for 48 h. Cell viability was measured using the WST-1 assay and the results (percentage of respective controls; mean of duplicates) are shown, each dot within vertical scatter plots represents a single donor (n = 7); the mean +/− SEM is depicted. To show the variability of controls each point was calculated as percentage of the mean of controls set as 100%. HAECs transfected with either siLPP3 or siCtrl were treated with inhibitors of either LPA formation (PF8380) or S1P receptor (FTY720) (C). HAECs transfected with Ctrl- or LPP3-containing plasmids were treated with LPA mimic [(2S)-OMPT] or S1P (D). HAECs were transfected with either control plasmids, WT LPP3, or with mutants of the catalytic domain (H249P or H251P) or of the adhesion motif (RGD->RAD), subsequently the WST-1 assays were performed. The results (mean of triplicates) in panels C, D, and E (percentage of respective controls) are shown, each dot within vertical scatter plots represents a single donor (n = 3); the mean +/− SEM is depicted. Caspase-3 and -7 activity was assessed using Apo-ONE® Homogeneous Caspase-3/7 Assay (F) and the relative fluorescence was measured using a microplate reader. The results (mean of duplicates) are shown as percentage of respective controls set at 100%, each dot within vertical scatter plots represents a single donor (n = 8); the mean +/− SEM is depicted. *P < 0.05, **P < 0.001. When more than three groups were compared a global P-value is: panel A, P = 0.006; panel C, P = 0.08; panel D, P = 0.04. In panel A we also give the P-value of 0.072 for si Ctrl vs siCtrl + VEGF and in panel E the P = 0.054 for siLPP3 to show the trend.

