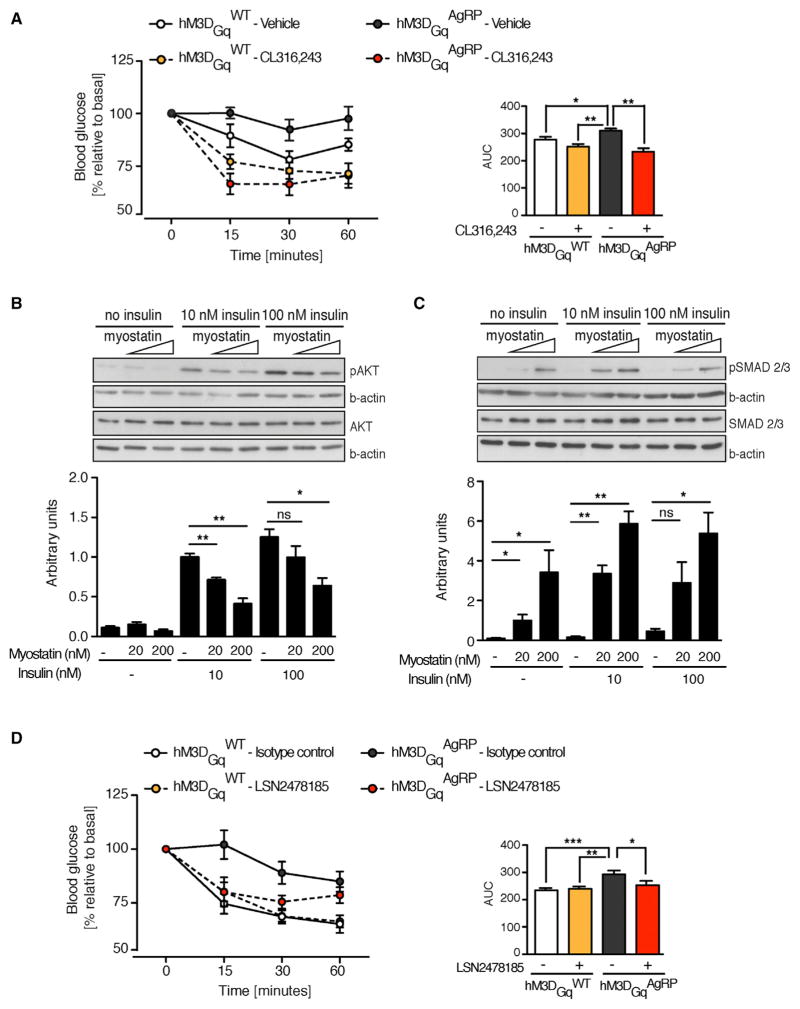
Figure 5. Elevated BAT Myostatin Expression Promotes Insulin Resistance.
(A) Insulin tolerance test in hM3DGqAgRP and hM3DGqWT mice (n = 7 versus 10) following co-injection of a selective β3-adrenergic agonist (CL 316,243) and CNO, or CNO and vehicle (saline).
(B and C) Representative blots and quantification of pAKT (B) and pSMAD 2/3 (C) from protein lysates of cultured, immortalized brown adipocytes treated with recombinant myostatin in the presence, or absence, of exogenous insulin at the indicated concentrations (n = 3–4 independent experiments).
(D) Insulin tolerance test in CNO-treated hM3DGqAgRP and hM3DGqWT mice 12 hr following subcutaneous injection of myostatin neutralizing antibodies (LSN2478185) or isotype control (n = 7 versus 10 for each treatment). Data are represented as mean ± SEM. *p ≤ 0.05, **p ≤ 0.01, and ***p ≤ 0.001 as determined by one-way ANOVA followed by Newman-Keuls post hoc test.

