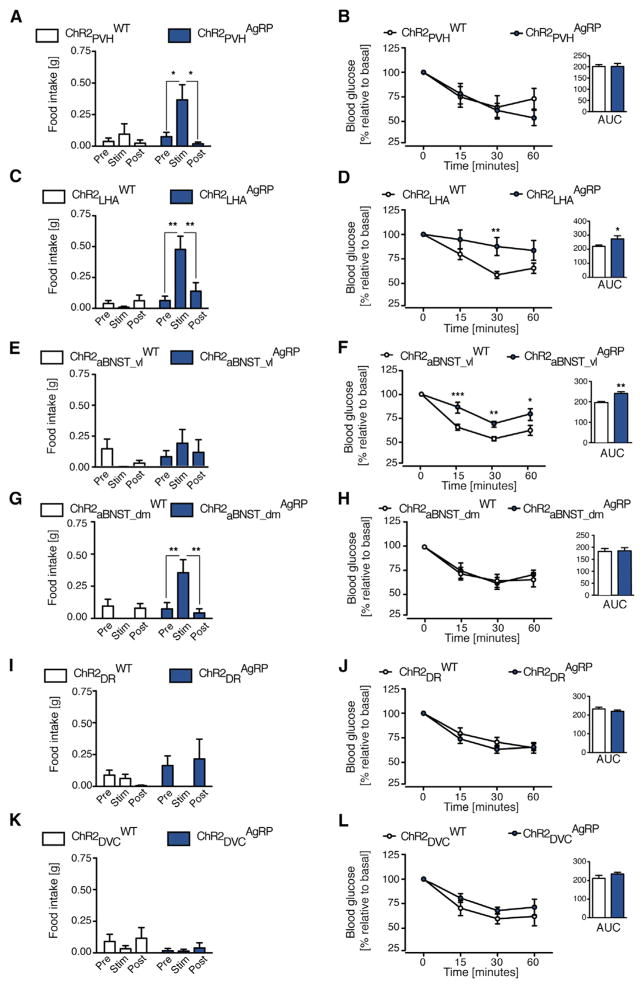
Figure 6. AgRP → LHA and AgRP → aBNST_vl Projections Control Peripheral Insulin Sensitivity.
Food intake before (pre), during (stim), and after (post) photostimulation (1 hr per period) and insulin tolerance test (ITT) and respective area under the curve (AUC) in ChR2AgRP mice and ChR2WT mice laser-light stimulated in the following AgRP neuron projection sites: (A and B) the paraventricular nucleus of the hypothalamus (PVH) (n = 7 versus 6); (C and D) the lateral hypothalamic area (LHA) (n = 14 versus 11–13); (E and F) the ventrolateral anterior bed nucleus of the stria terminalis (aBNST_vl) (n = 10 versus 9); (G and H) the dorsomedial part of the anterior bed nucleus of the striaterminalis (aBNST_dm) (n = 11 versus 9); (I and J) the dorsal raphe nucleus (DR) (n = 8–9 versus 6); and (K and L) the dorsal vagal complex (DVC) (n = 6–7 versus 5–6). Data are represented as mean ± SEM. *p ≤ 0.05, **p ≤ 0.01, and ***p ≤ 0.001 as determined by one-way ANOVA followed by Newman-Keuls post hoc test for food intake, by two-way ANOVA followed by Bonferroni post hoc test for ITT curves and by unpaired Student’s t test for the AUC graphs.

