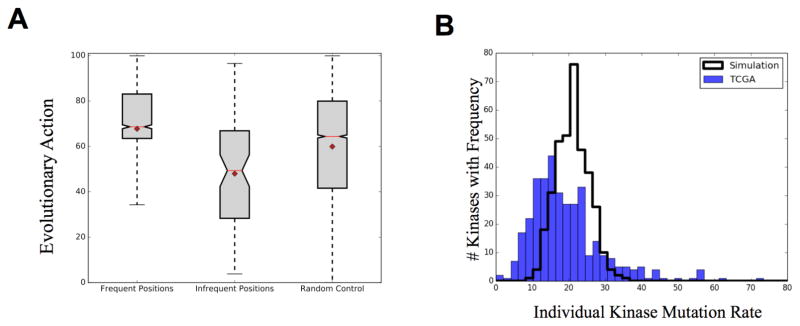
Fig 3.
(A) High frequency mutations are significantly biased towards high impact mutations (Pvalue=5*10−28) while low frequency mutations are biased towards low predicted impact (Pvalue 2.5*10−05). Mean=diamond Median=red line Whisk=2STD (B) Observed kinase mutation rate compared to computer simulation of random mutations. BRAF and CHEK2 (550 and 160 mutations, respectively) not shown on plot.

