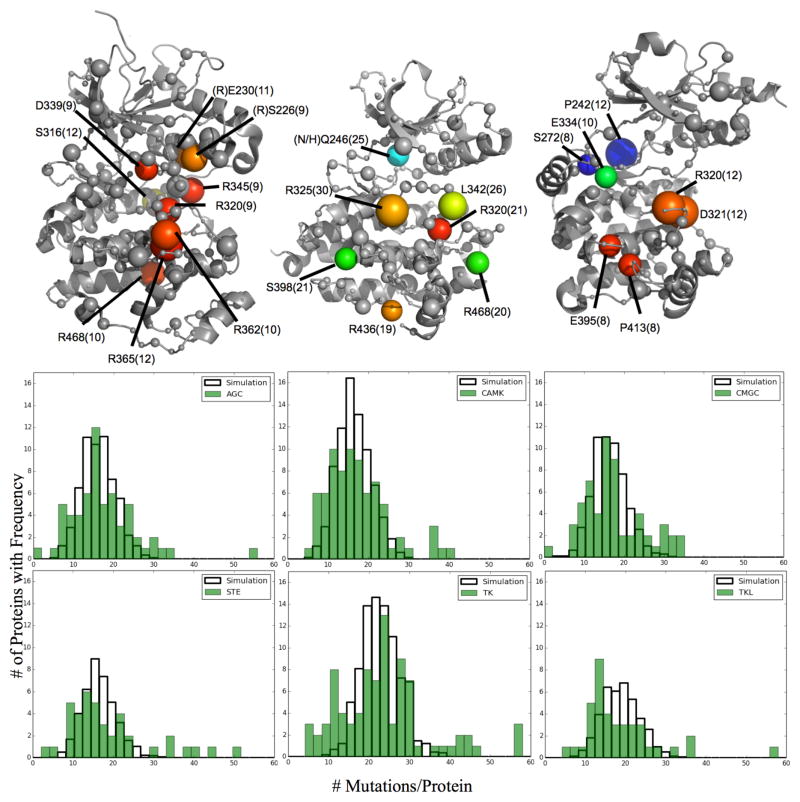
Fig 4.
Individual kinase subclasses are frequently mutated at distinct positions (Left to Right: CMGC, TK, STE kinases). Sphere Size=Frequency, Color= ET importance from high to low (red to blue) for each representative kinase: ERK1, EphA5, PAK1 (respectively). All labels are based on ACTR2B numbering. (B) The protein mutation rate for each kinase class was compared against a simulated random distribution specific to the total number of mutations and proteins in each class. BRAF (TKL) and CHEK2 (CAMK) are not shown on their respective figures

