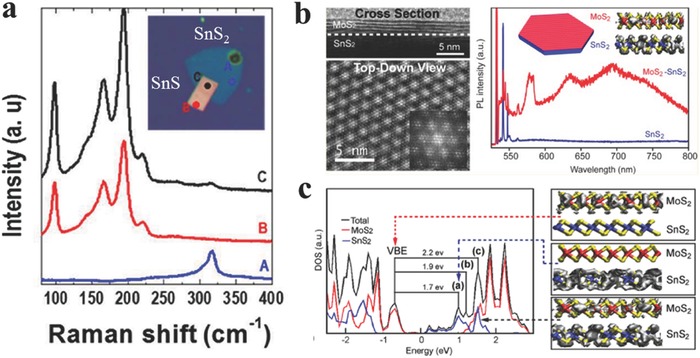
Figure 7.

a) Raman spectra of SnS2 (blue), SnS (red), and the overlap region (black). The inset shows the corresponding optical image of vertical heterostructure. Reproduced with permission.130 2015, American Chemical Society. b) Cross‐sectional TEM image and PL spectra of the MoS2/SnS2 heterostuctures. c) Calculated total and projected density of state for the 5‐L MoS2/SnS2 heterostructure, and charge density for several states of the 1‐L MoS2/SnS2 heterostructure: the valence band edge (VBE) top, a representative state within peak (a) (middle), and a mixed‐character state within peak (c), lying approximately 1.8 eV above the Fermi level (bottom). (b,c) Reproduced with permission.245 2014, American Chemical Society.
