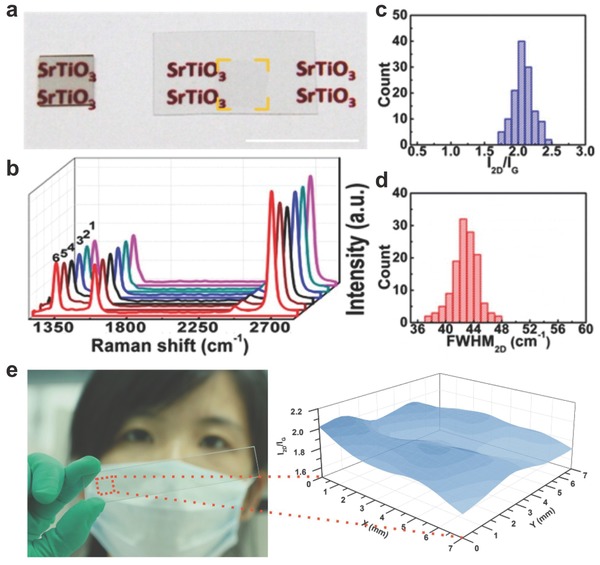
Figure 3.

a) Photograph of a graphene/SrTiO3 sample (left) and a transferred graphene film to a PET sheet (right). Scale bar: 1 cm. b−d) Plot of six typically collected spectra (b), histograms of the I 2D/I G ratios (c), and fwhm2D distribution (d) over a 3 × 3 mm2 sample area. e) Schematic diagram of the oxygen‐aided CVD growth of graphene on a SiO2/Si substrate. a–d) Reproduced with permission.35 Copyright 2014, American Chemical Society. e) Reproduced with permission.36
