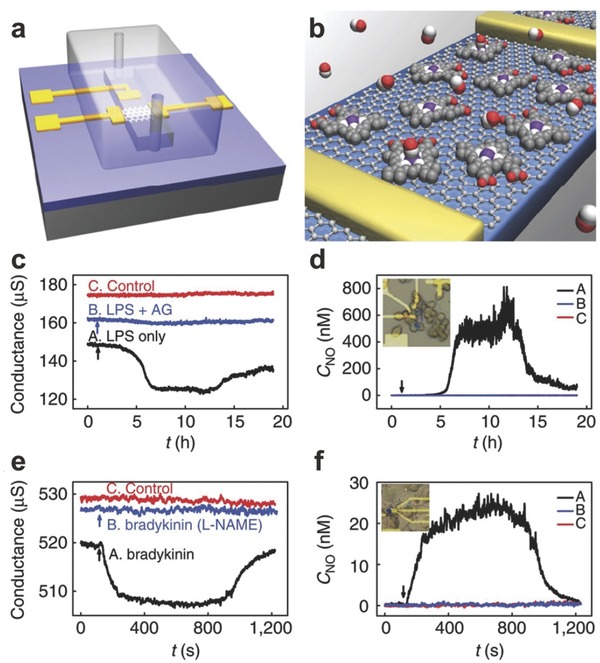
Figure 12.

Real‐time monitoring of NO released from living cells. a–b) The schematic of graphene‐hemin gas sensor. c–d) Real‐time detection of the NO concentration released from Raw 264.7 macrophage cells. e–f) Real‐time monitoring of NO released from HUVECs. Reproduced with permission.123 Copyright 2013, Nature Publishing Group.
