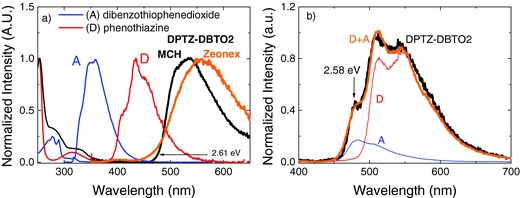
Figure 2.

a) Absorption and emission spectra of DPTZ‐DBTO2 in MCH, compared with spectra of the individual D and A fragments; comparison between the DPTZ‐DBTO2 fluorescence in MCH and zeonex. b) DPTZ‐DBTO2 phosphorescence spectra in zeonex at 80 K (black), compared with the phosphorescence of the individual D (red) and A (blue) fragments.
