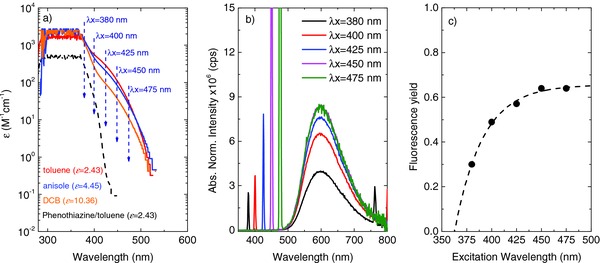
Figure 5.

a) Molar extinction coefficients of DPTZ‐DBTO2 obtained in solvents with increasing dielectric constant, showing a blueshift indicative of an nπ* transition, in panel (5a) the spectra are represented in a log scale to highlight the differences to the phenothiazine donor absorption, and the wavelengths used to selectively excite the new absorption band are indicated. b) Fluorescence emission spectra of DPTZ‐DBTO2 in toluene solution obtained in front‐face geometry, with increasing excitation wavelength and normalized to the light absorption at the excitation wavelength. c) For direct excitation of the nπ* into the CT state, the fluorescence yield in MCH is as high as 0.6.
