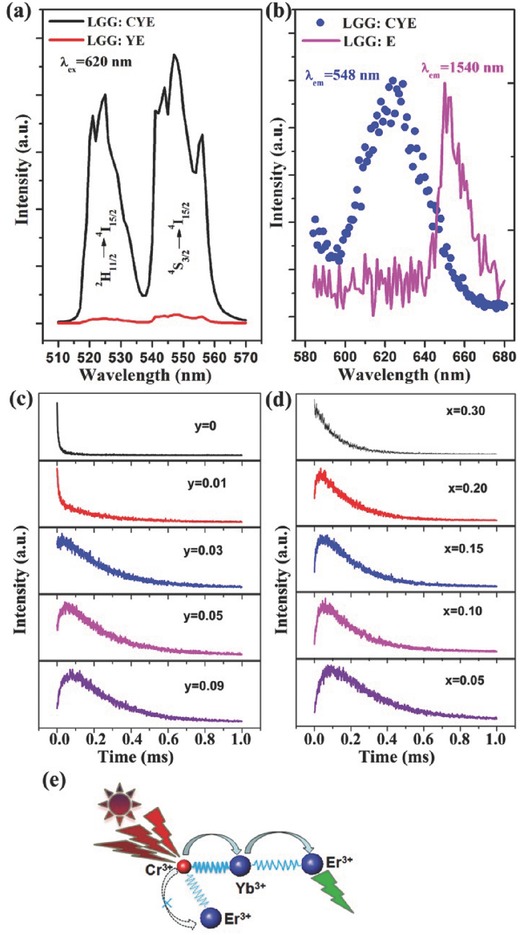
Figure 21.

a) UC luminescence spectra of LGG:CYE(short for La2.82Ga4.95GeO14: 0.05Cr3+, 0.12Yb3+, 0.06Er3+) and LGG:YE (short for La2.82Ga5GeO14:0.12Yb3+, 0.06Er3+) pumped by an OPO pulsed laser(620 nm) with the same power density(about 50 mW mm–2); b) the monitored 548 nm UC emission intensity pumped by different wavelengths(blue filled circle); for comparison, excitation peak of LGG:E(short for La2.94Ga5GeO14:0.06Er3+) at around 650 nm is also demonstrated(magenta line); UC luminescence decay curves of LGG: 0.10Cr3+, yYb3+, 0.06Er3+ (c) and LGG: xCr3+, 0.12Yb3+, 0.06Er3+ (d) pumped by an OPO pulsed laser (λex = 620 nm, λem = 548 nm); e) Illustration of energy transfer pathway in the UC process in this system. Reproduced with permission.75 Copyright 2014, OSA.
