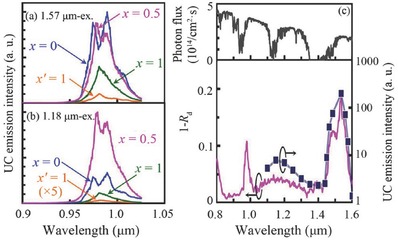
Figure 22.

UC emission spectra of the 10% Er, 0.5% Ni, and 0.5% Nb‐doped LaGa1– xScxO3 (x = 0, 0.5, and 1) and LaInO3 (x' = 1) powder samples excited at (a) 1570 nm and (b) 1180 nm; (c) Comparison of the absorbance (1–Rd) and UC sensitivity of the sample with x = 0.5 (lower), the AM1.5G solar spectrum (upper) is also shown for reference. Reproduced with permission.76 Copyright 2016, AIP Publishing LLC.
