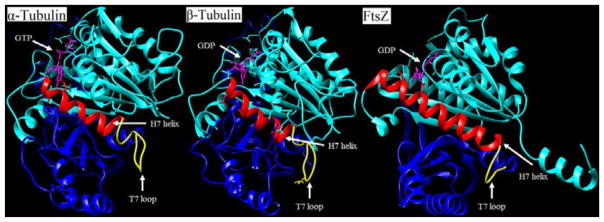
Figure 1.
Comparisons of α-tubulin, β-tubulin, and FtsZ monomer. Cyan colored-region is the N-terminal domain. The red-colored region is the H7 helix. The yellow-colored region is the T7 loop. The blue-colored region is the C-terminal domain. The magenta-colored molecule is GDP/GTP, which sits in the nucleotide binding site. (PDB entries 1TUB for tubulins and 2VAP for FtsZ).

