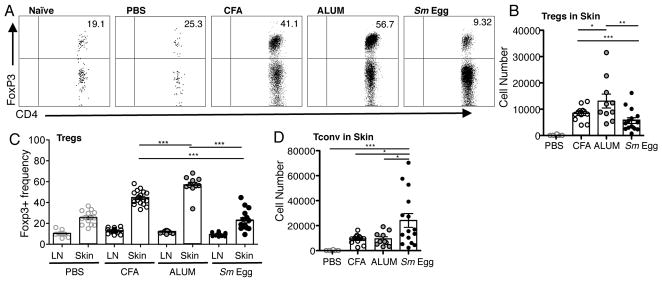
FIGURE 1.
Distinct polyclonal Treg accumulation in the skin with different types of adjuvant-induced inflammation. (A) Representative FACS plots of CD4+ Foxp3+ Tregs cells in inflamed skin, d7 after immunization of BALB/c mice with OVA protein in CFA, Alum or Sm Egg. Numbers in quadrant are % of CD4+ T cells. (B) Number of Foxp3+CD4+ Tregs in the skin on d7. Each symbol represents an individual mouse. (C) Frequency of Foxp3+ Tregs within the CD4 compartment in dLN (LN) and skin as in (A). (D) Number of Foxp3− CD4+ Tconv cells in skin on d7. 4 independent experiments, 3–4 mice per group. Statistics by Mann-Whitney.

