FIGURE 7.
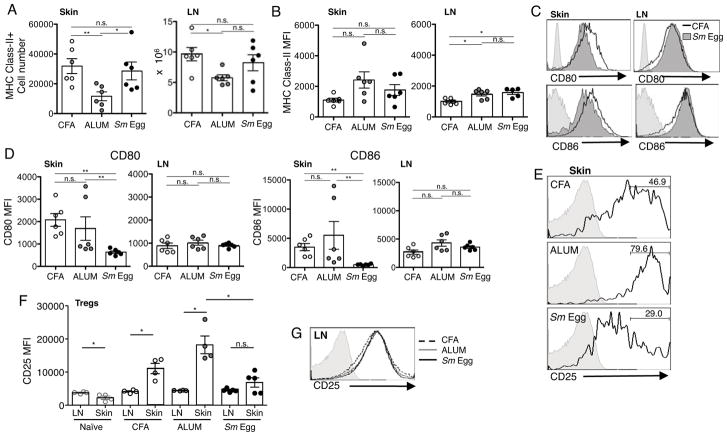
Differential expression of CD80/CD86 by tissue APCs correlates with differential expression of CD25 by Tregs. Analysis of APCs in inflamed skin, d7 after immunization of BALB/c mice with OVA protein in CFA, Alum or Sm Egg. (A) Number of MHC Class II+ cells in the inflamed ear and dLN. (B) MHC Class II MFI. (C) Representative FACS profiles of CD80 and CD86 expression on MHC Class II+ CD11c+ CD11b+ T cells. (D) CD80 and CD86 MFI. (E) CD25 levels on polyclonal Foxp3+ Tregs in the skin d7 post-immunization. Grey filled histogram, FMO; solid line, CD25 expression; numbers, % of cells in CD25hi gate. (F) CD25 MFI of all Tregs from LN and skin. Statistics by Paired T Test between LN and skin; Mann Whitney between skin groups. (G) Representative histogram of CD25 levels on Foxp3+ Tregs in LN d7 post-immunization.

